Minimal
This minimal example should help in understanding the very basics of how the library operates in terms of creating a MatLab figure.
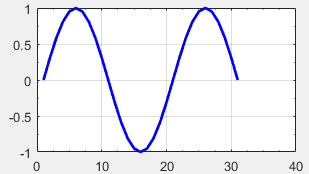
COM Library |
Equivalent MatLab code |
Lib.Execute "x = 0:pi/10:3*pi" Lib.Execute "y = sin(x)" Lib.Figure.Plot(1).Signal(1).Name = "y" Lib.Figure.Display |
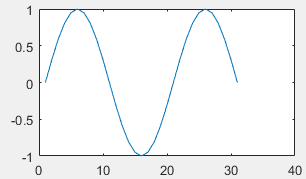
>> x = 0:pi/10:3*pi; >> y = sin(x); >> plot(y) |
|
|
With this simple case there is really no significant advantage.
Some notable differences between the plot generated from the Toolkit Library vs just MatLab
1) You can remain in your home development environment
2) With the configuration defaults the Color, Width, Grid lines, Minor Tic marks, Display Position and Size can all be set
The advantages build rapidly when the figures get more involved.