Configure

The point of the default configuration is so that you can define a number of settings so that you don't have to specify them each time you use various library commands.
Lib.Configure
This command opens the following dialog
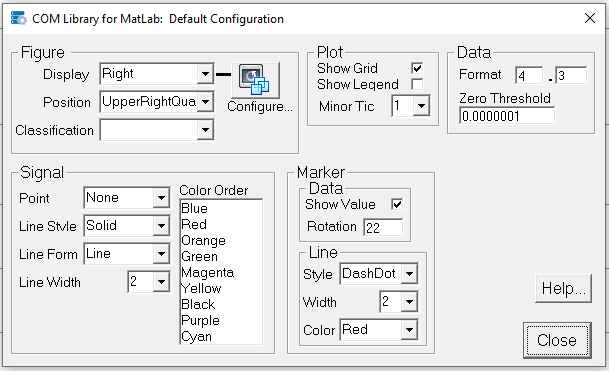
Figure:
Display: Which is your default Display
Position: Which is your default Display position
Classification If you need to have your Figures marked with a classification
Configure Setup the displays that you have on your system
Plot
ShowGrid: If you want the MatLab Grid to displayed by default
Show Legend If you want the Legend to be display by default
MinorTic: The configuration item can only be set here
Signal
Point: The default point style
Line Style The default signal line Style
Line Form: The default signal line Form
Line Width: The default signal line Width
Color Order: The default color order
Data
Format: Allows the control of the number of digits to the left and right of the decimal point.
Zero Threshold Controls how the formatting works
See: Data.Display for more information
Marker Data
Show Value: Display the marker Location value in the Marker Text
Rotation: Set the angle (deg) of the Marker Text
Marker Line
Line Style The default marker line Style
Line Width: The default marker line Width
Line Color: The default marker line Color