Full Featured
With this more involved example we introduce multiple Signals, Axis Scaling , Limiting and Markers.
Dim sig As Signal
Dim axs As AxisM
Dim mkr As Marker
Dim loc As MarkerPartLocation
Lib.Connect ' Connect to MatLab
Lib.Data.Clear ' Clear MatLab
Lib.Figure.Initialize ' Initialize Fig structure.
Lib.Execute "xi = linspace(-2*pi,2*pi,50)" ' create X-axis data
Lib.Execute "y1 = sin(xi)"
Lib.Execute "y2 = sign(cos(xi))"
Lib.Execute "y3= sin(xi)./xi
Lib.Figure.Title = "Figure Title"
Lib.Figure.Cols = 1
Lib.Figure.Rows = 2
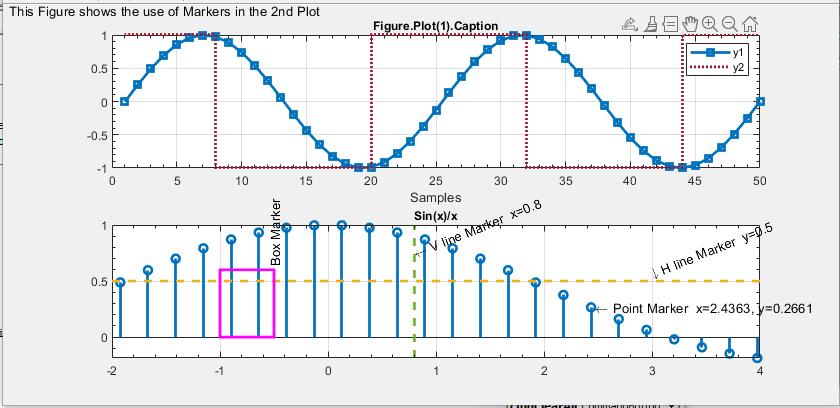
Lib.Figure.Information = "This Figure shows the use of Markers in the 2nd Plot"
' ---------------------------------------- Plot 1 --------
Lib.Figure.plot(1).Caption = "Figure.Plot(1).Caption"
Lib.Figure.plot(1).ShowLegend = True
Lib.Figure.plot(1).Signal(1).Point = ePoint.Square
Lib.Figure.plot(1).Signal(1).Name = "y1"
Lib.Figure.plot(1).Interaction = eInteraction.Edit
Set sig = Lib.Figure.plot(1).Signal(2)
sig.Name = "y2"
sig.Color = eColor.Red
sig.Style = eStyle.Dot
sig.Form = eForm.Step
Set axs = Lib.Figure.plot(1).Axis
axs.X.Label = "Samples"
axs.Y.Label = "Signals"
' ---------------------------------------- Plot 2 --------
Lib.Figure.plot(2).Caption = "Sin(x)/x"
Set sig = Lib.Figure.plot(2).Signal(1)
sig.Name = "y3"
sig.Form = eForm.Stem
Lib.Figure.plot(2).Index.Name = "xi" 'Note that this sets the X-Axis
Set axs = Lib.Figure.plot(2).Axis
axs.X.Limit.Min = -2
axs.X.Limit.Max = 4
Set mkr = Lib.Figure.plot(2).Marker(1)
mkr.Hline.Caption.Text = "H line Marker y="
mkr.Hline.Location.Y = 0.5
mkr.Hline.Color = Orange
mkr.Hline.Style = Dash
Set mkr = Lib.Figure.plot(2).Marker(2)
mkr.Vline.Caption.Text = "V line Marker x="
mkr.Vline.Location.X = 0.8
mkr.Vline.Color = Green
mkr.Vline.Style = Dash
Set mkr = Lib.Figure.plot(2).Marker(3)
Set loc = mkr.Point.Location
mkr.Point.Caption.Text = "Point Marker"
mkr.Point.Caption.Rotation = 0
loc.X = 2.4363: loc.Y = 0.26607
Set mkr = Lib.Figure.plot(2).Marker(4)
Set loc = mkr.Box.Location
mkr.Box.Caption.Text = "Box Marker"
mkr.Box.Caption.Rotation = 90
mkr.Box.Color = Magenta
loc.X = -1: loc.Y = 0: loc.H = 0.6: loc.W = 0.5
Lib.Figure.Display