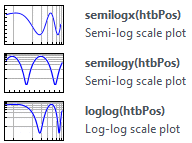
LibraryFigurePlot (10)Axis... Log Whether the axis is logarithmically scaled or not Fig.Plot(1..10).Axis.[X|Y].Log = True|False Boolean: True, False Default: False Setting both the X and Y log properties to True will create a LogLog plot